With Report Designer, you can force a data-bound control to calculate one of the standard summary functions (Average, Summary, Count, Running Summary, Percentage, Max or Min).
To calculate summaries (totals) within a report, follow the instructions below.
-
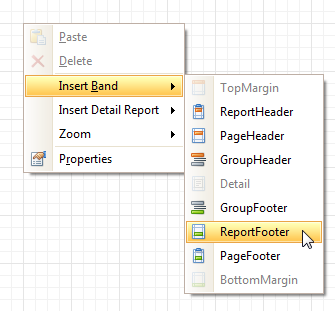
To display the result at the bottom of a report, the Report Footer band should be present. To add it, right-click anywhere over the report's area and in the invoked Context Menu, select Insert Band | ReportFooter.

-
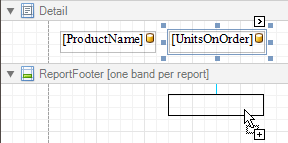
Click the field for which a summary will be calculated, to select it. Then, hold down CTRL and drag the field onto the Report Footer area, to create an exact copy of the Label that will display the summary.

 Note
Note You can also create a new label for your total by simply dragging it from the Control Toolbox.
-
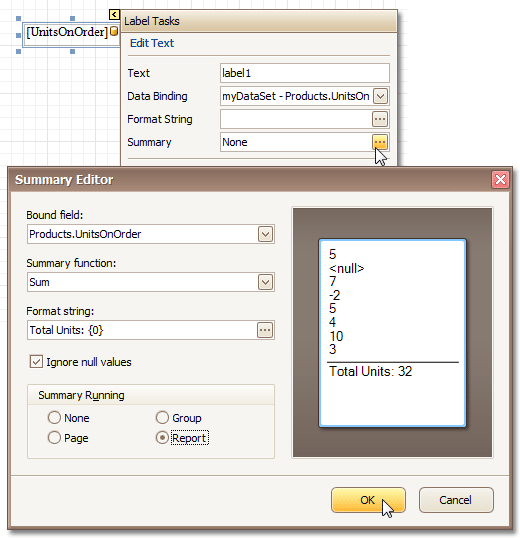
Now, select the newly created Label, click its Smart Tag, and in its actions list, click the ellipsis button for the Summary item. And, in the invoked Summary Editor, specify the summary options.
The following image shows an example of how you can set up your total. Note that the Summary Running option is set to Report, to ensure that all values from the specified data field are taken into account.

 Note
Note The Ignore NULL values option won't affect the result in this example, since NULL values are treated like zeros, by default. So, Sum won't change whether these values are taken into account or not. This option makes sense for functions like Count or Average, because the number of elements counted will depend on it.
Note also that value formatting is applied to a summary independently of the general formatting, and has a greater priority.
When calculating totals for groups, you can sort the groups against a summary function result.
To save the settings and close the dialog, click OK.
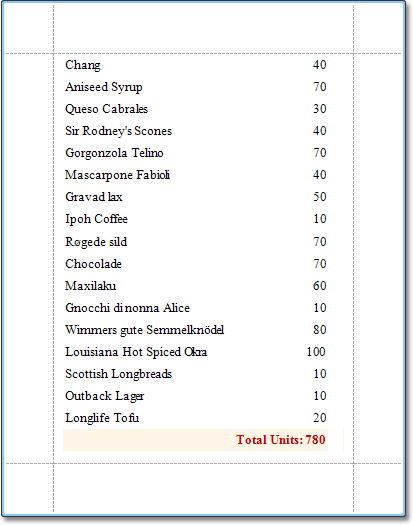
Switch to the Preview Tab, and view the result.


