The Pivot Grid control represents dynamic data (obtained from an underlying data source) in a cross-tabulated form to create cross-tab reports, similar to Pivot Tables in Microsoft Excel®. Column headers display unique values from one data field, and row headers - from another field. Each cell displays a summary for the corresponding row and column values. By specifying different data fields, you can see different totals. This allows you to get a compact layout for a complex data analysis.
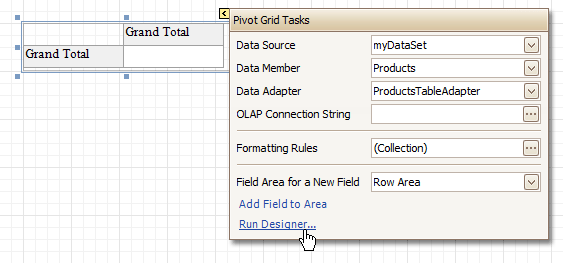
The Pivot Grid has a designer which allows you to easily adjust its layout. It can be invoked using the control's Smart Tag.
For more information on using this control, refer to Pivot Table.
In the Property Grid, the Pivot Grid's properties are divided into the following groups.
 Appearance
- Appearance
Allows you to define the appearance properties (such as Background Color, Foreground Color, Font, etc.) for the Pivot Grid's elements (Cell, Field Value, Filter Separator, Header Group Line, etc.).
- Formatting Rules
Invokes the Formatting Rules Editor allowing you to choose which rules should be applied to the control during report generation, and define the precedence of the applied rules. To learn more on this, refer to Conditionally Change a Control's Appearance.
- Styles
Allows you to invoke the Styles Editor, which is intended to manage and customize the control's styles, which then can be assigned to the Pivot Grid's elements.
Behavior
- Anchor Vertically
Specifies the vertical anchoring style of the Pivot Grid, so that after page rendering it stays attached to the top control, bottom control, or both.
- Keep Together
Specifies whether the contents of the control can be horizontally split across pages. In other words, if the control occupies more space than remains on the page, this property specifies whether this Pivot Grid should be split between the current page and the next, or whether it will be printed entirely on the next page. This property is in effect only when a Pivot Grid's content does not fit on the current page. If it does not fit on the next page either, then the Pivot Grid will be split despite this property's value.
- Scripts
This property contains events, which you can handle by the required scripts. For more information on scripting, refer to Handle Events via Scripts.
-
Visible
Specifies whether the control should be visible in print preview.
Data
- Data Adapter
Determines a data adapter that will populate a Pivot Grid's data source which is assigned via the Data Source property. It is automatically set to the appropriate value, when the Data Member property is defined. To learn more on this, refer to Cross-Tab Report.
- Data Member
Determines the data source member which supplies data to a Pivot Grid. To learn more on this, refer to Cross-Tab Report.
 Note Note |
|---|
Usually, it is not necessary to specify the Data Member property when binding a Pivot Grid to data. This property should only be set directly if the dataset contains more than one table. |
- Data Source
Determines a Pivot Grid's data source. To learn more on this, refer to Cross-Tab Report.
- Fields
Invokes the Pivot Grid Field Collection Editor, allowing you to manage and fully customize a Pivot Grid's fields.
- OLAP Connection String
Specifies a connection string to a cube in an Microsoft Analysis Services database. A sample connection string is shown below:
OLAPConnectionString="Provider=msolap;Data Source=localhost;Initial Catalog=Adventure Works DW;Cube Name=Adventure Works;Query Timeout=100;"
A connection string can be built via the Connection String Editor. To invoke it, click the ellipsis button for the OLAP Connection String property.
To represent information from the bound cube, create specific Pivot Grid fields, and bind them to the required fields in the data source.
If the OLAP Connection String property is set to a valid string, the value of the Data Source property is cleared. Setting the Data Source property to a valid object clears the OLAP Connection String property.
- Prefilter
When this property is expanded in the Property Grid, you can set its Enabled property to Yes, and use the Criteria property to invoke the Pivot Grid Prefilter dialog.
This dialog allows you to build complex filter criteria with an unlimited number of filter conditions, combined by logical operators. It provides a set of logical operators that significantly simplify the process of creating filters for text, numeric and date-time fields.
| Note |
|---|
The Prefilter is not supported in OLAP mode. |
Design
Layout
Navigation
Options
- Data Field Options
Allows you to customize the options which control the presentation of the data fields.
- Data Options
Allows you to define whether a Pivot Grid's fields must be case sensitive or not.
- Options Chart Data Source
Provides access to the options controlling the display of the Pivot Grid's data in a Chart.
- Print Options
Allows you to customize the print options of a Pivot Grid.
- View Options
Allows you to customize the Pivot Grid's display options.
All trademarks and registered trademarks are the property of their respective owners.


