This tutorial describes the steps to create a cross-tab report using a Pivot Grid control. This feature should not be confused with the master-detail report or table report.
To create a cross-tab report, do the following.
-
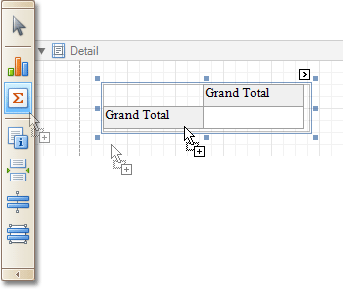
Drop the Pivot Grid control from the Toolbox onto the report's Detail band.
-
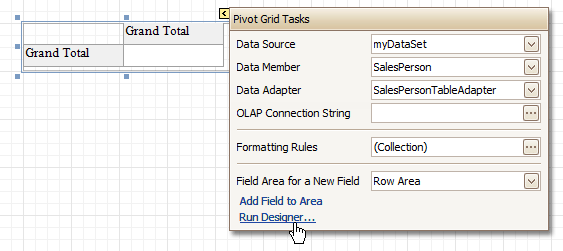
To bind the pivot grid to a data source, click its Smart Tag, and in the invoked actions list, expand the Data Source drop-down selector and click Add New DataSource.
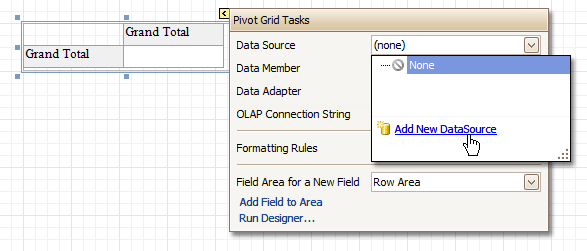
The invoked Report Wizard will guide you through the process of assigning a data source to the grid. For detailed instructions on the Wizard's steps, refer to Bind a Report to Data, as this process is similar.
 Note
Note Note that after these steps, the report's Data Source property must be set to None.
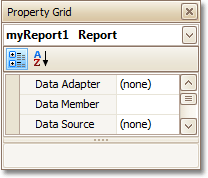
Otherwise, the grid will be blank at the preview and repeated as many times as there are records in the data source.
-
After the dataset is created, it is assigned to the grid's Data Source property. Its Data Member property defines from which table or view of your dataset the grid obtains its data. And, the Data Adapter property is auto-defined, as well.
So once again, click the grid's Smart Tag, and in the invoked actions list, click the Run Designer... link.
-
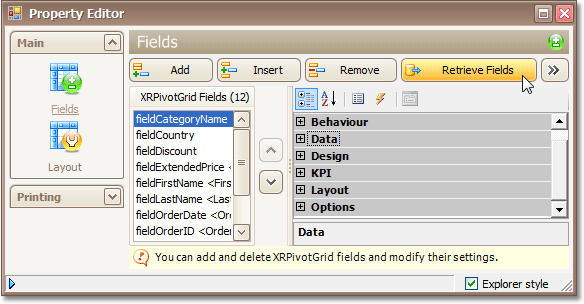
In the invoked Property Editor, click Retrieve Fields.
-
Then, switch to the Layout section in the navigation bar on the left.
Drag and drop the required fields to the Row Fields, Column Fields and Data Items areas.
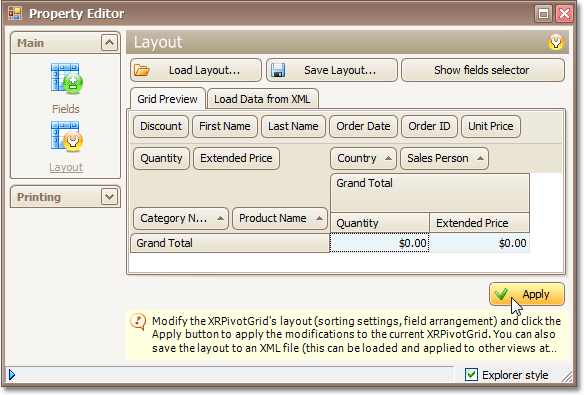
Click Apply and close the editor.
-
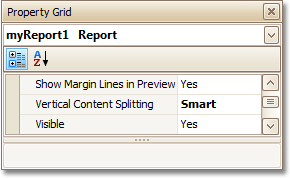
In the last step, you can set your report's Vertical Content Splitting option to Smart. This will split the grid's columns precisely by their borders in the Print Preview.
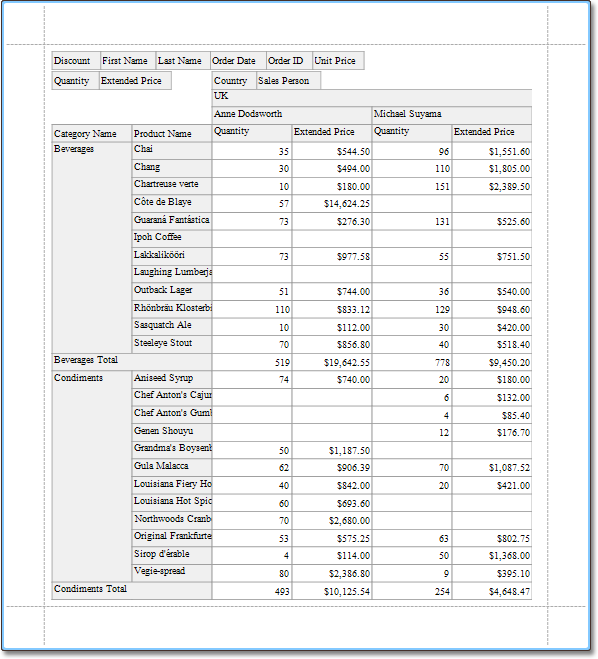
The cross-tab report is now ready. Switch to the Preview Tab, and view the result.